
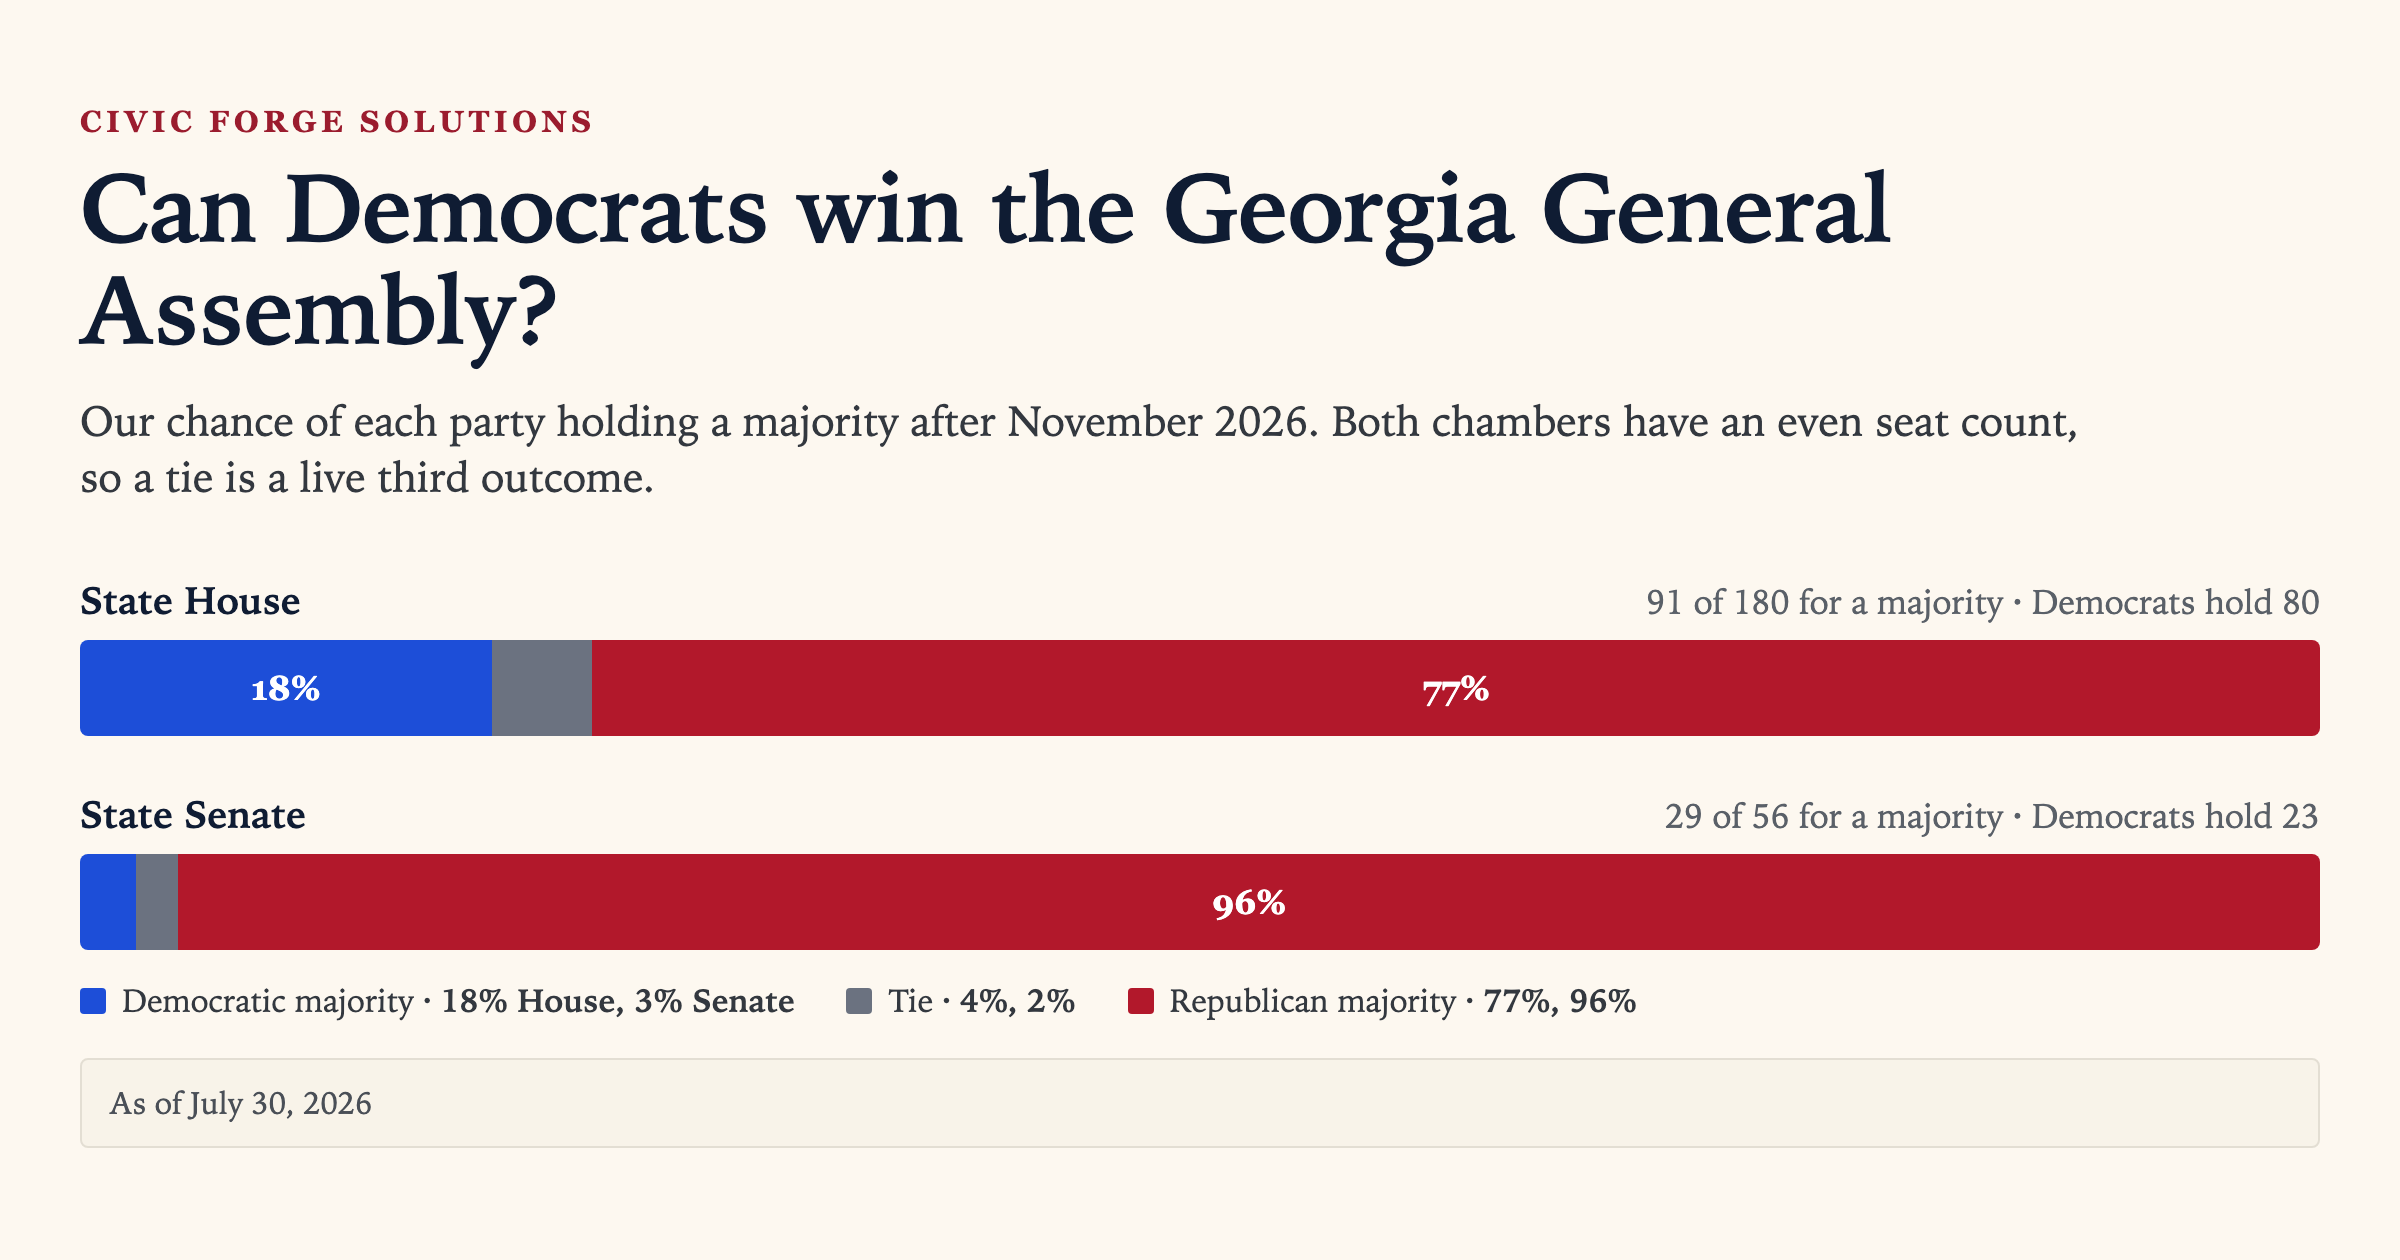
Democrats have an 18% chance of winning a majority in the Georgia House, a 4% chance of a 90–90 tie, and Republicans are favored at 77%. The majority line is 91 of 180 seats; Democrats hold 80 today.
In the Senate the odds are worse: 3% Democratic, 2% a 28–28 tie, 96% Republican. The majority line is 29 of 56 seats; Democrats hold 23 today.
These figures will move over the coming weeks. They are a July reading of a November election, and each new statewide poll shifts them.
Who controls the Georgia General Assembly after November 2026
Three outcomes, not two. Both chambers have an even seat count, so a tie is possible and the Democratic and Republican figures do not sum to 100%. As of July 30, 2026.
State House
91 of 180 for a majority- Democratic majority 18%
- Tie 4% (90–90)
- Republican majority 77%
State Senate
29 of 56 for a majority- Democratic majority 3%
- Tie 2% (28–28)
- Republican majority 96%
In the Senate a tie is nearly as likely as a Democratic majority.
The House: near certain to hold, a stretch to flip
The single 18% figure hides more than it shows. The model produces a full distribution across every possible seat total. Each row below is cumulative: the chance Democrats win at least that many seats, never the chance of exactly that number.
State House: the chance Democrats win at least this many seats
Every row is cumulative: the chance of that many seats or more. They are not the chance of exactly that number, and differencing two rows does not give one. Democrats hold 80 now; 91 of 180 is a majority (★).
Democrats hold 80 House seats now, and the model gives them a 92% chance of holding at least that many. The most likely single outcome is 86 seats, six more than they have. Reaching 86 or more is close to a coin flip at 49%.
The majority is 91, five seats past the most likely outcome. That is a stretch rather than a fantasy: the 90% range runs from 79 to 96 seats, so a majority sits inside the range of plausible results but well above its center.
One way to see how far 91 is: the seat that would deliver the majority sits in a district about 8 margin points more Republican than the state as a whole. Democrats would need a statewide result good enough to carry it.
The Senate has a cliff, not a slope
The Senate at 3% looks like a rounding error next to the House at 18%. The seat distribution explains why.
State Senate: the chance Democrats win at least this many seats
Every row is cumulative: the chance of that many seats or more. They are not the chance of exactly that number, and differencing two rows does not give one. Democrats hold 23 now; 29 of 56 is a majority (★).
Ten Senate seats have no Republican candidate at all, and 13 more are rated Safe D. That is 23 seats before a single voter is contacted, exactly what Democrats hold today. The model puts a 98% chance on reaching 23.
The 24th seat drops that to 40%. Everything after it is uphill, and 29 is out of reach: the seat that would deliver a Senate majority leans about 12 margin points Republican. There is no Senate toss-up anywhere on the map.
That is the shape of the chamber: not a gradual climb but a settled floor, one genuine contest above it, and then a wall.
A third of the legislature was decided in March
None of the figures above apply to 81 of the 236 seats, because in those only one major party filed a candidate. Those races ended at the March qualifying deadline, splitting 50 to Democrats and 31 to Republicans. No model is involved, and no voter in them has a choice between the parties in November.
Those seats are a settled fact rather than a confident prediction, kept structurally separate from everything the model produces. They enter the chamber arithmetic as fixed counts and contribute no uncertainty.
Of the 155 seats that are contested, only three are genuine toss-ups: HD-48, HD-53, and HD-151. All three are currently Republican held, and none are in the Senate. The full district-by-district breakdown is in Georgia 2026 Legislative Ratings.
Everything rests on one number, and it is mostly the Governor’s race
Every district’s rating starts from its own partisan lean and then adds the statewide climate. Our estimate of that climate for state offices is D+3.8 on the margin scale, blended from the three statewide races that have been polled.
| Race | Polls | Estimate | Weight in the blend |
|---|---|---|---|
| Governor | 5 (about 4,100 people) | D+3.2 | 82% |
| State House generic ballot | 1 (448 people) | D+8.8 | 9% |
| Lieutenant Governor | 1 (448 people) | D+4.6 | 9% |
The blend weights each race by how precisely it has been measured, which means the Governor’s race carries 82% of it. The one poll that actually asks Georgians how they will vote for the legislature is a single 448 person survey carrying 9%.
Those weights are published rather than adjusted, because moving weight toward the legislative question would mean asserting that it is more relevant, and relevance is a judgment call rather than a measurement. It is a real limitation, and it is the reason the next good legislative poll matters more than its sample size suggests.
Here is how much the chamber numbers move with that one estimate, holding every district’s lean fixed:
| If the statewide climate is | D chance, House | D chance, Senate |
|---|---|---|
| Even | 6% | under 1% |
| D+2 | 11% | 1% |
| D+3.8 (our estimate) | 18% | 3% |
| D+6 | 28% | 5% |
| D+8 | 40% | 9% |
Every figure in this article is downstream of that table. The House goes from a long shot to close to even money across a range of statewide results that all look reasonable today.
Method and limits
Chamber odds are not the sum of district odds. Multiplying the 155 contested probabilities together treats each seat as an independent coin flip, and the seats are not independent: a statewide polling miss moves all 180 House districts the same direction at once. Independence puts the House seat total at plus or minus 2.1 seats against a true plus or minus 5.3, two and a half times more precise than the evidence supports. The chamber figures come from the joint distribution and are never derived from the district table. Methodology and the full dataset are at Georgia 2026 Legislative Ratings.
Incumbency is measured but not installed. The House effect is statistically clear on its own, but the Senate coefficient comes out with the opposite sign, and a real incumbency advantage should not reverse between two chambers of the same legislature. Installing it would lower the Democratic figures by roughly 4 points, concentrated in the seats nearest the majority line.
Independent candidates are invisible to the model, which builds its candidate field from party qualifying records. Three have qualified for legislative races, including HD-151, already a toss-up, and HD-137, currently carried as a certain Democratic seat. No probability has been adjusted for them.
District leans rest on two cycles, 2022 and 2024, because earlier cycles do not pass the data quality checks. HD-147 sits a near-zero distance from the line between Lean R and Toss-up, so its label comes from rounding rather than from any real difference between the two.
Figures as of July 30, 2026.