
Civic Forge Solutions published ratings for all 236 seats in the Georgia General Assembly for the November 2026 General Election, as of Jul 27, 2026.
Learn more about our ratings here.
Each State House and State Senate districts gets two ratings. One for how it votes for the legislature, and one for how it votes for federal office.
Our ratings indicate if a district is a “Safe”, “Likely”, “Lean” district for Democrats and Republicans - or, “Toss-Up”
Only some of the seats in the General Assembly are competitive
In 81 of the 236 seats, only one major party filed a candidate. Those seats were decided at the March qualifying deadline, splitting 50 to Democrats and 31 to Republicans.
The field did get more crowded, compared to 2024. Republicans ran unopposed in 47 House districts in 2024; this cycle that number is 21.
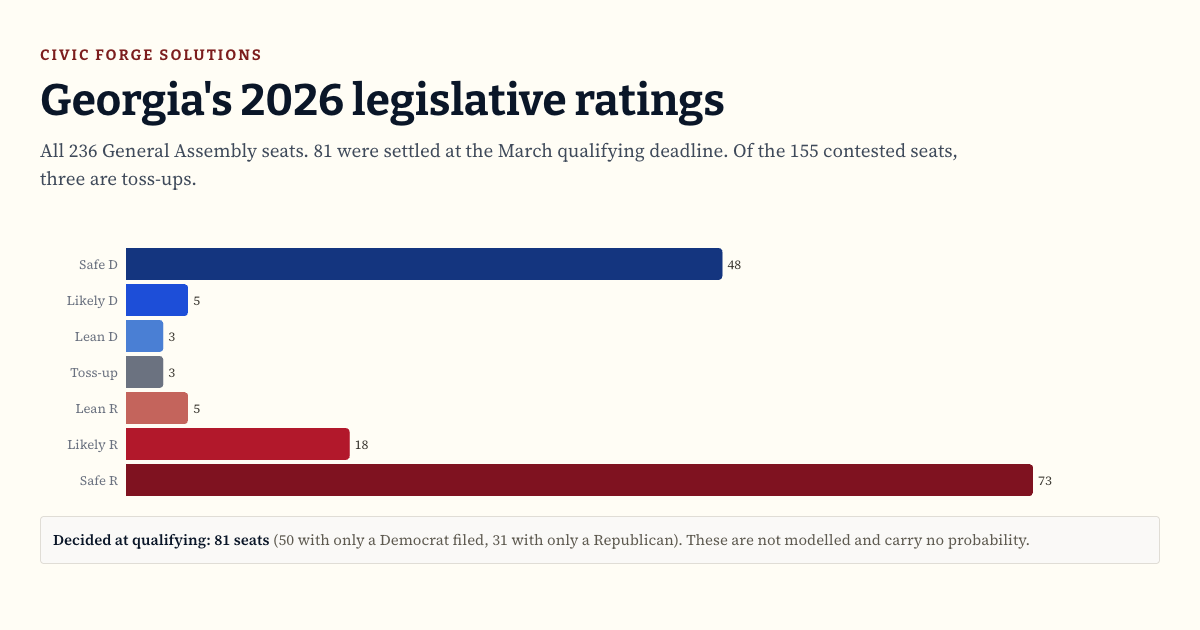
Across the 155 contested seats, the counts are 48 Safe D, 5 Likely D, 3 Lean D, 3 Toss-up, 5 Lean R, 18 Likely R, and 73 Safe R. The election happens in a handful of places.
The contested field, General Assembly
State-office rating across the 155 contested seats. The 81 uncontested seats are held out below, because a seat with one filer is a settled fact rather than a modelled probability.
Gerrymandering limits competition
Georgia’s state legislative districts are presently gerrymandered to favor Republicans. Accordingly, the number of districts in actual contention is relatively small.
Of 119 contested House districts, 28 fall outside Safe. Of 36 contested Senate districts, 6 do.
Only three seats are genuine coin flips: House Districts 48, 53, and 151. All three are Republican-held, and none are in the Senate.
The table below lists all 28 competitive House districts. The last column is how far the statewide climate must move, in margin points, for the rating category to change. Sort by it to see which labels are holding on by the least.
Republicans hold 23 of these 28. The five Democratic-held seats are all rated Lean or Likely D, and appear only because they fall outside Safe.
Every competitive Senate seat is Republican-held.
Across all 180 House seats the model favors a Democrat in 85, against 80 held now; across 56 Senate seats it favors a Democrat in 23, the same as now. A House majority takes 91 seats and a Senate majority 29.
Those are counts of individual district ratings, not a forecast of chamber control, because a polling miss moves every district at once and the seats cannot simply be added up.
We provide ratings for both state-level and federal-level offices
Georgians vote more Democratic for federal office than for the legislature. The gap is worth about five margin points statewide.
House District 48 is the clearest case. It leans Democratic for federal office and sits several points Republican for the legislature, in the same election.
The gap is not uniform. It varies by about 3.8 margin points across House districts, which is why we publish two ratings rather than one.
The federal rating is a partisan-lean measure, not a forecast of a federal race. Most legislative districts do not line up with any federal district.
How the ratings are built
Every input is public: certified election results, the candidate qualifying list, statewide polls, and precinct-to-district maps. We use no private or unpublished data.
Each district’s lean comes from statewide races, not past legislative results. In about half of legislative races one party fields no candidate, so those results measure ballot access rather than preference.
Public polls set the climate. They currently run about 3.8 margin points Democratic for state office and about 9 margin points for the federal measure. (If polls shift, these shifts will be reflected in a change in political climate, which will also shift our ratings.)
That climate is added to each district’s lean. Turning the result into a probability requires an error estimate, which we build from a statewide error (floored near 5.8 margin points) and a district-level error (about 5 margin points in the House).
We tested the model on 2024 using district-level data through 2022. The test is not fully out of sample: it fits a single statewide level to the 2024 results it then scores, so it measures how well the model ranks districts, not how well it would have called the statewide climate. On that basis it ranked 98% of contested House races correctly and all 23 Senate races, missing House vote share by 1.7 points on the share scale, or 3.4 on the margin scale.
When we update
We refresh the ratings as new statewide polling arrives, not on a fixed calendar. A cluster of fresh polls can shift the climate and reshuffle the seats nearest a category line; a quiet stretch leaves the ratings where they are.
Not every poll counts equally. We weight trusted, higher-quality pollsters more heavily than weaker or unproven ones, and we discount polls that are older or less precise and correct for a pollster’s measured house lean before it enters the average.
The model also grows more confident on its own as November nears. The statewide-uncertainty floor tightens as election day approaches, so the same lean yields a firmer rating later in the cycle.