
Qualifying closed this week for Georgia’s 2026 general elections. 697 candidates filed across the State House, State Senate, US House, and statewide offices — 308 Republicans and 389 Democrats.
Here’s the breakdown by chamber:
| Chamber | Races | Republicans | Democrats |
|---|---|---|---|
| State House | 180 | 160 | 230 |
| State Senate | 56 | 68 | 78 |
| US House | 14 | 40 | 43 |
| Statewide | 11 | 40 | 38 |
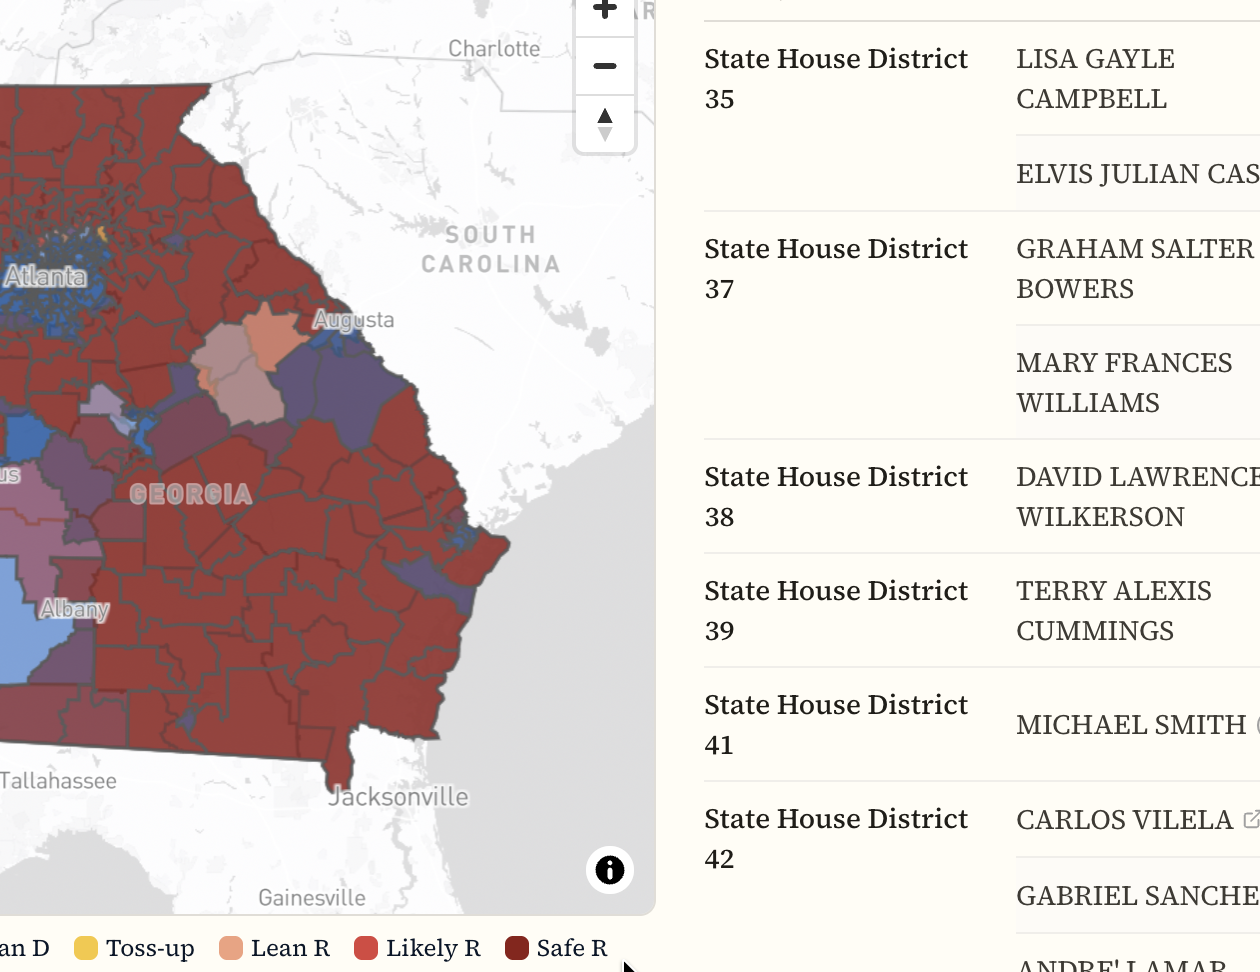
Browse every candidate on the interactive map.
What the Dashboard Shows
The map colors every district by its projected lean, based on a blend of the 2024 presidential margin and the last contested D vs. R result. Click any district to see who’s running. Click any row in the table to zoom the map to that district.
A few ways to dig in:
Filter by party. Toggle between All, Dem, and Rep to see where each party is fielding candidates and where they aren’t.
Filter by competitiveness. Narrow the map to just Toss-up, Lean, Likely, or Safe districts to focus on the races that will actually decide control.
Model a wave. The slider at the top lets you shift the entire map by up to 10 points in either direction. Drag it toward D+10 and watch which districts flip. Drag it toward R+10 and see how much margin Republicans have to spare.
Lean scores blend the 2024 presidential margin (60%) with the last contested D vs. R race result (40%). Presidential vote shares are reconstructed at the district level from precinct-level results; split precincts are allocated proportionally. Analysis by Civic Forge Solutions. Qualifying data sourced from Georgia Secretary of State records.