
Data in this article is as-of Saturday, Feb 21st, 2026, reflecting ballots accepted through Friday, Feb 20th.
The Week in Numbers
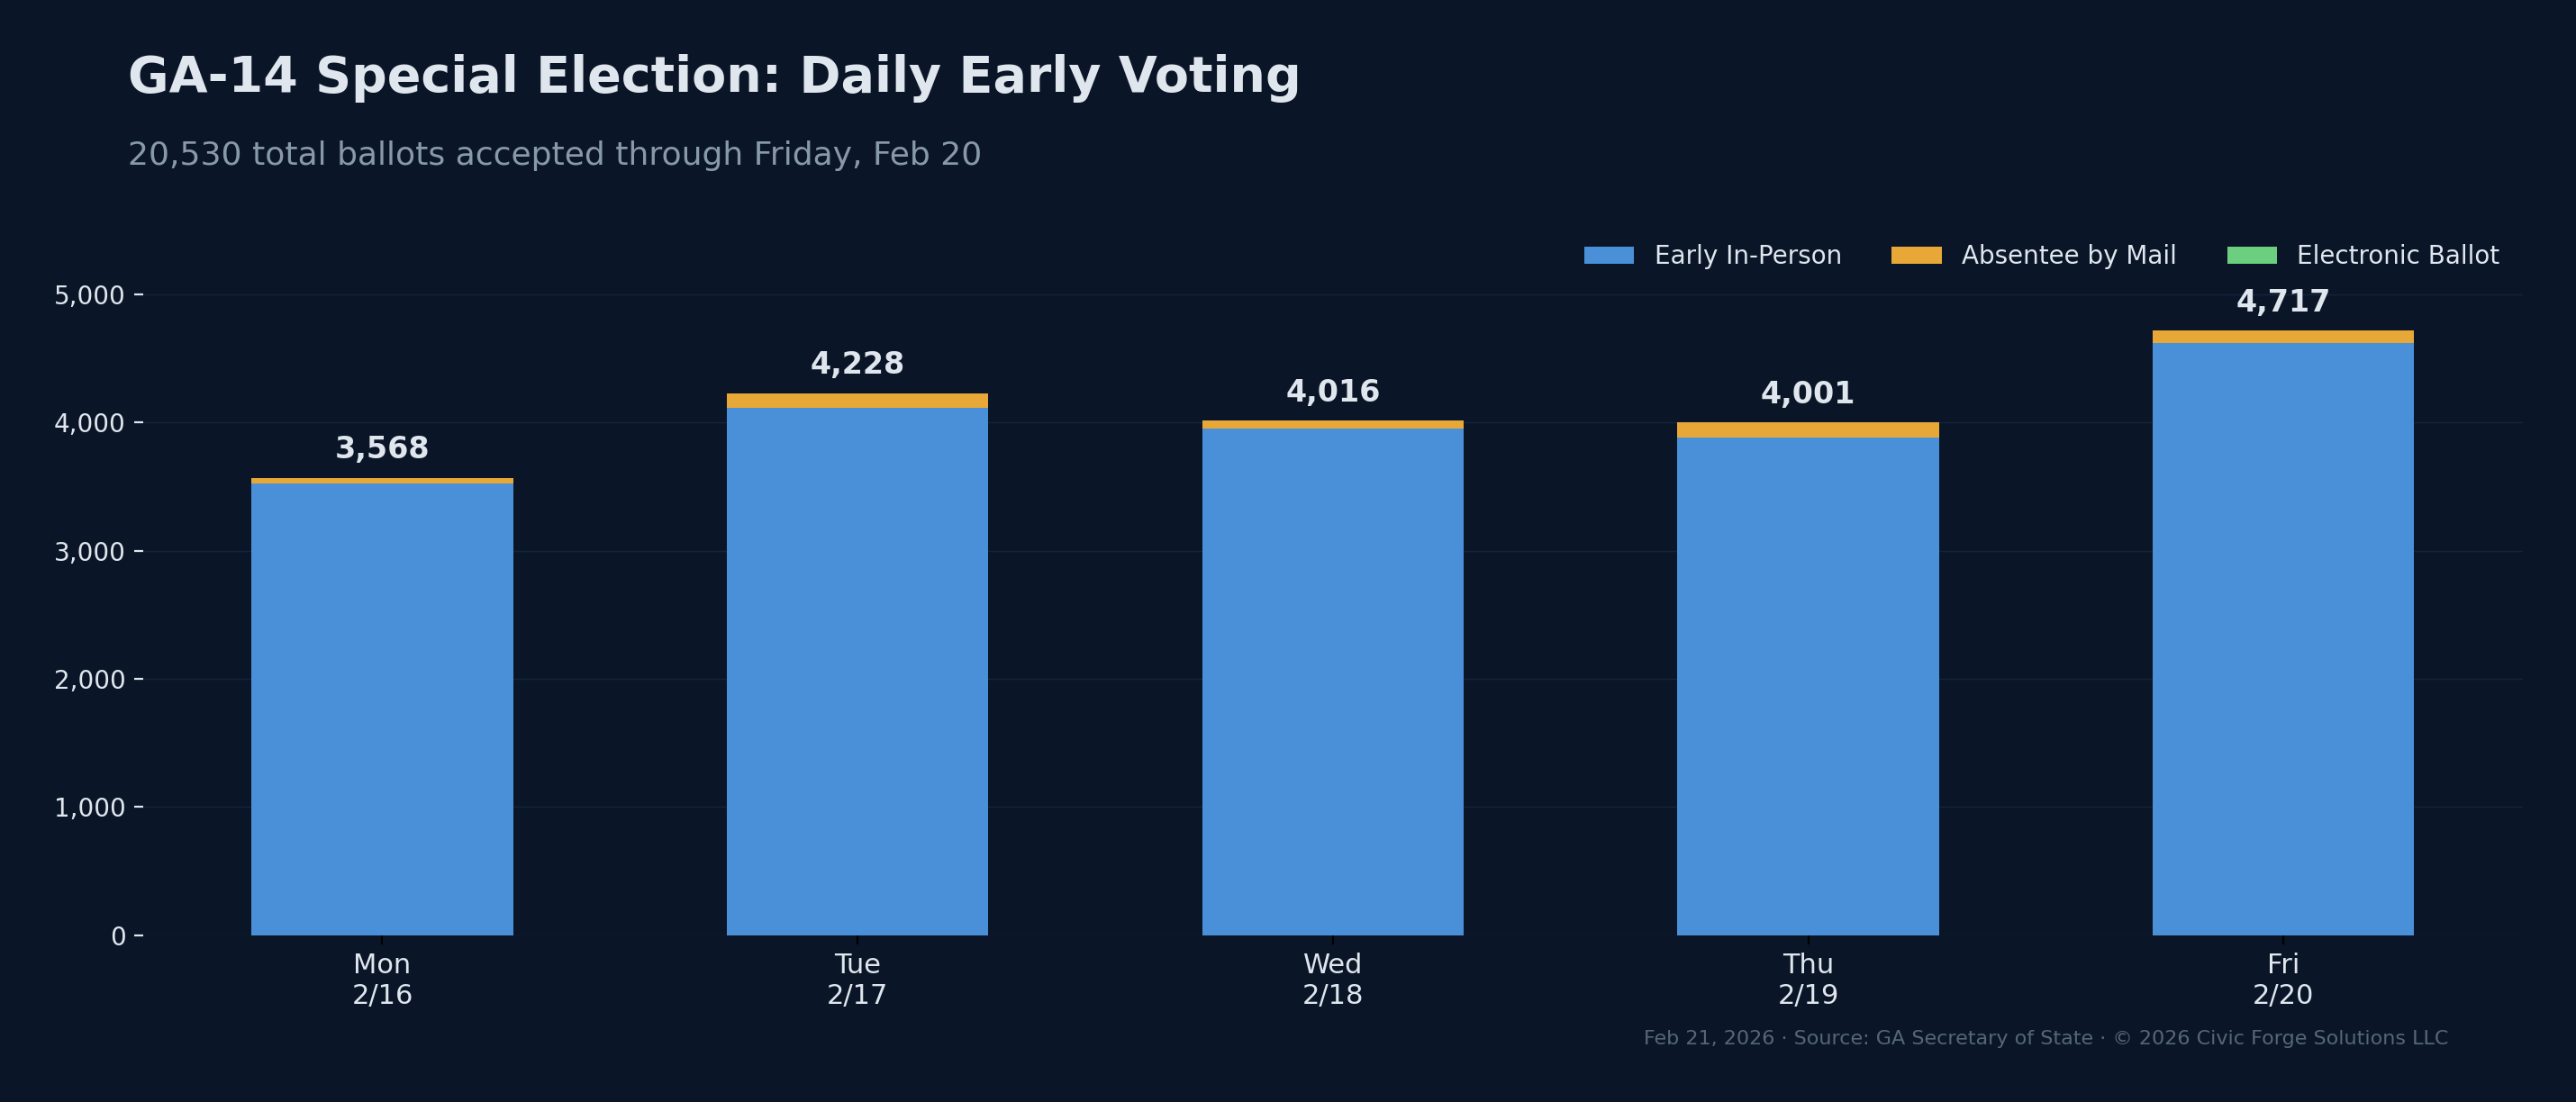
Five days into in-person early voting, 20,530 ballots have been returned across the 10 counties that make up GA-14. Friday was the biggest day yet, with 4,717 ballots, an 18% jump over Wednesday’s 4,016.
Daily Ballot Activity
20,530 total ballotsSource: GA Secretary of State (Feb 21, 2026)
Methodology
Ballot counts come from the GA Secretary of State daily absentee ballot snapshot. Each row represents the number of ballots accepted on that date, broken down by ballot style: Early In-Person, Absentee by Mail, and Electronic Ballot Delivery.
Pre-early-voting ballots: A small number of mail and electronic ballots were accepted before the early voting period began on Feb 16. These are grouped into the Feb 16 bar for clarity, since they represent advance absentee activity rather than a separate voting day.
Only ballots with Ballot Status = A (accepted) in congressional district CNG-014 are counted. The acceptance date is the date the ballot was received and processed by the county elections office.
Source: GA Secretary of State daily absentee ballot snapshot (Feb 21, 2026).
Day-to-day voting patterns have largely matched expected trends. After a strong opening Monday (3,547) and Tuesday (4,228), turnout dipped slightly midweek before surging Friday. This is consistent with typical early voting behavior in Georgia, where voters tend to turn out heavily at the start and end of each week.
Typically, the last few days of early voting comprise 30 to 50 percent of all early voting.
Where the Votes Are
The county-level breakdown reveals a race being shaped by two counties in particular: Cobb and Paulding.
Together, these two counties account for 44% of all ballots cast so far: 4,785 from Cobb and 4,312 from Paulding. This is significant because they are also the two most competitive counties in the district:
- Cobb County (30 precincts in CD-14): Greene won by just +2.7 points here in 2024. Cobb’s GA-14 precincts sit on the northwestern edge of metro Atlanta, and they’re the closest thing to swing territory in the district.
- Paulding County (20 precincts): Greene’s margin was +18.2 points, still solidly Republican, but substantially tighter than the district’s deep-red rural counties where margins exceeded 45 points.
The main question is: what are the political motivations of voters in these potential swing districts? Next week, we’ll have some modeling to take some educated guesses.
Meanwhile, the most heavily Republican counties (Dade at +57.1 in 2024, Murray at +63.0, and Chattooga at +50.8) have contributed just 1,857 ballots combined, about 9% of the total.
What this means: Early voters are disproportionately coming from the parts of the district where Democratic candidates perform best. This doesn’t mean Democrats are winning. For example, a D+4 swing from 2024 baselines would leave the district solidly Republican; however, it does mean the electorate casting early ballots skews more competitive than the district as a whole.
Turnout Composition: Who Is Showing Up?
Raw vote counts only tell part of the story. To understand whether the early electorate is structurally different from 2024, we compare each county’s share of early votes to its share of the 2024 general election. If every precinct turned out at the same rate, these shares would match. They don’t.
| County | ’24 Margin | Share of ‘24 Vote | Share of ‘26 EV | Over/Under | ’26 EV Pace |
|---|---|---|---|---|---|
| Catoosa | R+45.5 | 9.1% | 13.1% | +4.0 | 7.9% |
| Chattooga | R+50.8 | 2.7% | 3.0% | +0.3 | 6.1% |
| Cobb | R+2.7 | 21.9% | 23.3% | +1.4 | 5.8% |
| Dade | R+57.1 | 2.1% | 2.6% | +0.5 | 6.7% |
| Floyd | R+32.9 | 11.6% | 14.7% | +3.1 | 6.9% |
| Murray | R+63.0 | 4.5% | 3.5% | −1.0 | 4.2% |
| Paulding | R+18.2 | 24.3% | 21.0% | −3.3 | 4.7% |
| Polk | R+54.3 | 5.0% | 6.3% | +1.3 | 6.9% |
| Walker | R+48.9 | 8.4% | 4.9% | −3.5 | 3.2% |
| Whitfield | R+32.2 | 10.4% | 7.7% | −2.7 | 4.0% |
Share of ‘24 Vote is each county’s portion of 375,660 total ballots cast in the 2024 CD-14 congressional race. Share of ‘26 EV is each county’s portion of the 20,530 early votes cast so far in 2026. Over/Under is the gap between the two. Positive means a county’s voters are over-represented in early vote, relative to 2024. ‘26 EV Pace is 2026 early votes as a percentage of the county’s 2024 total vote — a measure of relative activity, not a true turnout rate.
The biggest over-indexers are Catoosa (+4.0) and Floyd (+3.1). Both solidly Republican. But the biggest under-indexers are also Republican: Walker (−3.5), Paulding (−3.3), and Whitfield (−2.7). Cobb, the most competitive county, is over-represented (+1.4).
At the precinct level, the pattern is clearer. Grouping all 140 precincts into quartiles by their 2024 partisan lean:
- Most D-leaning precincts (Q1): 28.4% of early votes vs 27.1% expected, +1.2 points over-index
- Most R-leaning precincts (Q4): 14.0% of early votes vs 16.5% expected, −2.5 points under-index
- The middle two quartiles are close to their expected shares
If early voting turnout had perfectly mirrored 2024 proportions across all precincts, the simulated margin would be R+28.6. Instead, the actual early vote mix produces R+27.6, a compositional shift of roughly 1 point toward Democrats. This is entirely separate from any change in individual voter behavior; it reflects the mix of who is showing up early.
Simulated Partisan Breakdown
Starting with this update, we’ve upgraded our swing model to use precinct-level simulations rather than county-level averages. With enough data now flowing in, we can weight each of the 140 precincts in CD-14 individually, accounting for the fact that turnout within a county isn’t uniform. A Cobb precinct that went D+10 in 2024 contributes differently than one that went R+15, and our model now captures that variation. As the early voting period continues, the precinct-level mix will shift day to day, and the simulated margins will move with it.
At the 2024 baseline, the current early vote pool breaks roughly R+27.7, about 1.5 points narrower than Greene’s actual 2024 district-wide margin of +29. About one point of that gap comes from the compositional shift described above; D-leaning precincts are slightly over-represented in the early vote, with the remainder reflecting the precinct-level weighting methodology.
Use the slider below to model different swing scenarios. A D+4 swing (similar to what we saw in the State Senate 18 runoff) would bring the estimated margin down to roughly R+20. A D+15 swing, the threshold for a Democratic outright win, remains a steep climb.
No swing (2024 baseline)
Source: GA Secretary of State (Feb 21, 2026), Civic Forge Solutions
| County | Precincts | Absentee | Electronic | 2024 Margin | Est. Rep | Est. Dem | Est. Margin | |
|---|---|---|---|---|---|---|---|---|
| Catoosa | 11 | 2,684 | 49 | 0 | R+45.5 | 1,942 | 742 | R+44.7 |
| Chattooga | 5 | 619 | 19 | 0 | R+50.8 | 465 | 154 | R+50.2 |
| Cobb | 30 | 4,785 | 83 | 4 | R+2.7 | 2,487 | 2,298 | R+3.9 |
| Dade | 7 | 527 | 1 | 0 | R+57.1 | 411 | 116 | R+56.0 |
| Floyd | 19 | 3,008 | 31 | 1 | R+32.9 | 1,872 | 1,136 | R+24.5 |
| Murray | 7 | 711 | 11 | 0 | R+63.0 | 574 | 137 | R+61.5 |
| Paulding | 20 | 4,312 | 113 | 0 | R+18.2 | 2,576 | 1,736 | R+19.5 |
| Polk | 7 | 1,296 | 27 | 0 | R+54.3 | 989 | 307 | R+52.6 |
| Walker | 11 | 1,009 | 39 | 0 | R+48.9 | 776 | 233 | R+53.8 |
| Whitfield | 23 | 1,579 | 62 | 5 | R+32.2 | 1,012 | 567 | R+28.2 |
| Total | 140 | 20,530 | 435 | 10 | R+27.7 | 13,104 | 7,426 | R+27.7 |
Methodology
Georgia does not report party affiliation on absentee ballots for special elections. To estimate the partisan lean of early voters, we apply 2024 congressional two-party vote shares (Greene vs Harris) at the precinct level to current absentee ballot counts. Each of the 140 precincts in CD-14 has its own Rep/Dem split from 2024, and we allocate that precinct's absentee ballots accordingly. The county rows in the table aggregate these precinct-level estimates.
2024 Margin is the Greene–Harris margin from the November 2024 CD-14 congressional race at the county level, using only two-party votes. Est. Rep and Est. Dem are the sum of precinct-level simulated votes within each county, which may differ slightly from a flat county-average calculation because turnout is not uniform across precincts.
For a uniform swing of S points toward Democrats: each county's estimated Dem votes are increased by absentee × S / 100, clamped so neither side goes below zero. This models a scenario where every precinct shifts equally.
Caveats: This is a simulation, not a prediction. Early voters may differ from the general electorate. A 21-candidate jungle primary is structurally different from a two-party general. Precinct boundaries assume no meaningful change since November 2024.
Sources: GA Secretary of State 2024 CD-14 congressional election results; GA SOS daily absentee ballot snapshot (Feb 21, 2026).
CD-14 Precinct Map
The map below shows every precinct in CD-14, colored by its 2024 congressional margin. Hover over any precinct for detailed data including absentee ballot counts and simulated partisan breakdown.
Source: GA Secretary of State, Civic Forge Solutions
What to Watch
With 11 days of early voting remaining (through March 6), we’re tracking several indicators:
- Compositional shift: The most R-leaning precincts are under-indexing by 2.5 points relative to 2024. If this persists, or widens, it structurally advantages Democratic candidates independent of any swing in voter behavior. Conversely, if deep-red precincts surge in the final days, the compositional gap could close.
- Cobb share: If Cobb continues to over-index relative to its 2024 share, it compresses the district’s overall Republican margin. Watch whether Cobb’s 23% share holds, grows, or fades.
- Weekend and Monday patterns: Saturday voting is open today, and historically, Georgia’s early voting sees strong Monday turnout. Next week’s data will show whether the Friday surge was a blip or a trend.
- Mail ballot trajectory: Only 435 mail ballots have been returned so far (2.1% of total). In the 2024 general, mail ballots were a larger share. The low mail ballot count is consistent with a special election where most voters are choosing to vote in person.
Questions? Get in touch at [email protected].
Correction (2/22/26): A calculation error, now fixed, over-represented the early vote counts in 2026. The figures presented in this article are the corrected and validated figures.
Civic Forge Solutions provides civic technology and data analysis services for progressive and Democratic candidates, campaigns, and committees. Based in Atlanta, Georgia.