
Data in this article is as-of Friday, Feb 27th, 2026, reflecting ballots accepted through Thursday, Feb 26th.
Interactive dashboard: Explore all of this data (timeline slider, daily ballot chart, partisan lean choropleth, swing simulator, and county summary table) on our GA-14 Data Dashboard.
The Mid-Period Lull Arrives
Through ten days of early voting, 33,027 ballots have been accepted in the GA-14 special election, or 8.9% of the 372,297 total votes cast in the 2024 GA-14 general election (all ballot types, including Election Day). Eight EV days remain through March 6 (including one Sunday).
Thursday’s count of 2,155 ballots was the lowest weekday total of the entire early voting period, dropping below even Saturday’s 2,175. The Week 2 trend tells the story:
- Monday, Feb 23: 2,704 ballots
- Tuesday, Feb 24: 2,722 ballots
- Wednesday, Feb 25: 2,737 ballots
- Thursday, Feb 26: 2,155 ballots
Week 2’s Monday-through-Thursday total came in at 10,318, about 65% of Week 1’s pace over the same Mon-Thu window (15,793). This deceleration is typical of Georgia early voting patterns: an opening-week surge driven by the most motivated voters, followed by a quieter middle period before the final-week push.
Rain moved through northwest Georgia on Wednesday and Thursday, which may have contributed to Thursday’s lower count. Weather effects on early voting tend to be modest (voters who skip a rainy day usually show up later), but it’s worth noting as a potential factor. If Friday rebounds toward the 2,700 level, the Thursday dip was likely weather and normal variation. If the pace stays depressed into the weekend, it could signal a narrower final total.
Daily Ballot Activity
Turnout Forecast
With 10 days of data, our model projects approximately 55,000 to 57,000 total early ballots by the close of early voting on March 6, roughly 19% of the 292,044 early votes cast in the 2024 GA-14 general. Thursday’s lower number nudged the projection toward the lower end of that range, though one day doesn’t move the estimate dramatically.
The key variable is the final-week surge. In Georgia elections, the last 5 days of early voting typically account for 30–40% of all early ballots. If GA-14 follows that pattern, we’d expect daily totals to climb back above 3,000 starting next week.
Where the Votes Are Coming From
The updated turnout composition table, comparing each county’s share of 2026 early votes to its share of 2024 general election votes:
| County | ’24 Margin | Share of ‘24 Vote | Share of ‘26 EV | Over/Under | ’26 EV Pace |
|---|---|---|---|---|---|
| Catoosa | R+45.5 | 9.2% | 12.5% | +3.3 | 12.0% |
| Chattooga | R+52.0 | 2.8% | 3.3% | +0.4 | 10.2% |
| Cobb | R+2.7 | 22.1% | 23.5% | +1.4 | 9.5% |
| Dade | R+57.1 | 2.1% | 2.5% | +0.3 | 10.3% |
| Floyd | R+32.9 | 11.7% | 14.2% | +2.5 | 10.7% |
| Murray | R+63.0 | 4.6% | 3.4% | −1.1 | 6.6% |
| Paulding | R+21.0 | 23.5% | 21.5% | −2.0 | 8.1% |
| Polk | R+54.3 | 5.0% | 6.0% | +1.0 | 10.6% |
| Walker | R+48.9 | 8.4% | 4.9% | −3.5 | 5.2% |
| Whitfield | R+32.2 | 10.4% | 8.2% | −2.3 | 7.0% |
‘26 EV Pace is 2026 early votes as a percentage of each county’s total 2024 GA-14 vote, a measure of how far along each county is relative to its 2024 baseline (not a true turnout rate). Over/Under is the gap between the county’s share of 2026 EV and its share of 2024 total vote.
Analysis
- Catoosa (+3.3) remains the biggest over-indexer at a 12.0% EV pace, the highest of any county. This deep-red county (R+45.5) continues to punch above its weight.
- Floyd (+2.5) is running a 10.7% pace, making it the second-fastest county. Its over-representation, combined with Catoosa’s, gives Republicans a structural advantage in the early vote composition.
- Walker (−3.5) is still the most notable under-performer at just a 5.2% EV pace. As a strongly Republican county (R+48.9), Walker’s continued low activity partially offsets the Catoosa/Floyd surge.
- Paulding (−2.0) has narrowed its gap slightly from Day 8 (was −2.4). Its 8.1% pace is approaching the district average, and as the second-largest county, any movement matters.
- Cobb (+1.4) holds steady as a slight over-indexer. Its 9.5% pace keeps it the most active large county, and as the closest to a swing county (R+2.7), its relative over-representation provides a small structural boost for Democrats.
Net effect: The compositional picture remains broadly similar to Day 8. Republican-leaning counties (Catoosa, Floyd) are over-represented; Republican-leaning counties (Walker, Whitfield) are under-represented. Cobb’s consistent over-indexing provides a small Democratic offset. On balance, the county-level composition slightly favors Republicans compared to 2024 proportions, but the effect is modest.
Partisan Lean of Early Voters
Using each voter’s last partisan primary participation as a proxy for partisan ID:
- Republican primary voters: 18,792 (56.9%)
- Democratic primary voters: 10,260 (31.1%)
- No partisan primary history: 3,522 (10.7%)
- Non-partisan: 453 (1.4%)
The Republican share of the early vote has ticked up slightly from Day 8 (56.1% to 56.9%), while the Democratic share dipped (31.8% to 31.1%). The “no history” pool remains steady at 10.7%, serving as the uncertainty band around these estimates.
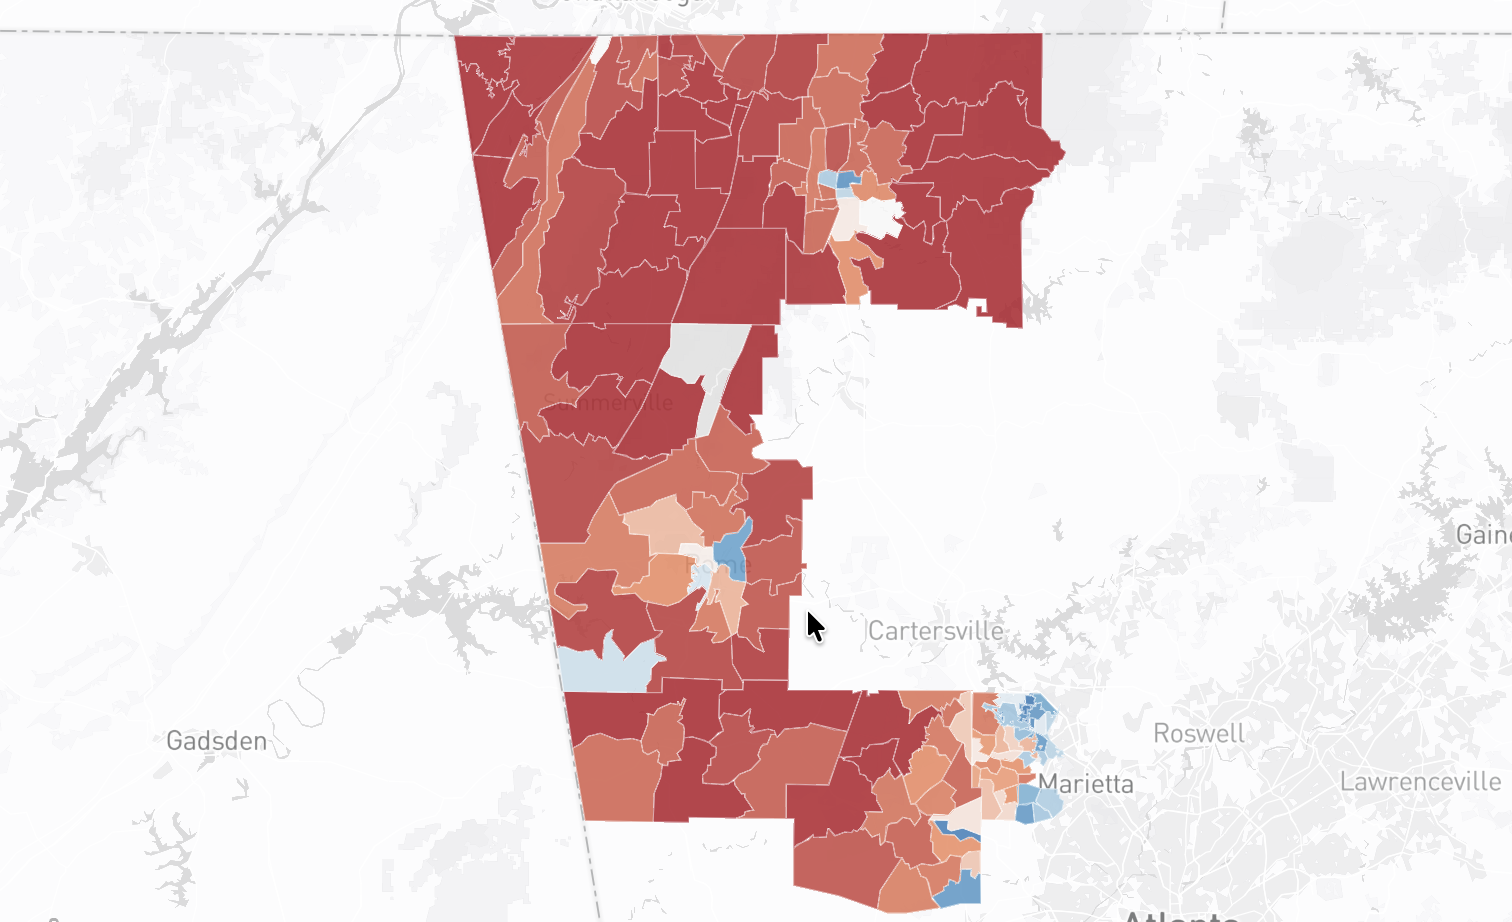
Explore the geographic distribution of partisan lean across GA-14’s precincts on our interactive choropleth map:
Swing Simulator
The swing simulator applies each precinct’s 2024 congressional two-party vote shares (Greene vs Harris) to its current early vote count, producing a precinct-weighted estimated margin of R+27.6 across the district. Use the slider to model uniform swing scenarios:
- A D+5 swing brings the margin to roughly R+18, still a comfortable Republican hold
- A D+10 swing brings it to roughly R+8, competitive but still Republican
- A D+15 swing is the approximate breakeven threshold
Looking Ahead: The Runoff Question
With 21 candidates on the March 10 ballot (16 Republicans, 3 Democrats, 1 Libertarian, and 1 independent), a runoff is very likely. No candidate is expected to clear the 50%+1 threshold needed to win outright, which means the top two vote-getters will advance to a runoff on April 7.
The early voting data strongly suggests a Republican-leaning electorate: Republican primary voters outnumber Democrats nearly 2-to-1 in the early vote pool. Nothing is certain (early voters are not the full electorate, and primary history is an imperfect proxy), but in a runoff between a Democrat and an electable Republican who can consolidate party support, the math is daunting for the Democratic candidate.
The most viable Democratic paths to winning the seat require a favorable runoff matchup: either two Democrats advance (unlikely given the district’s partisan composition), or the Republican runoff candidate is unable to consolidate support from the broader Republican electorate. A fractured Republican field on March 10 doesn’t necessarily translate into a fractured runoff, but it’s the scenario where Democrats have the best chance.
What to Watch This Weekend
We’re entering the pivotal stretch of the early voting period. Here’s what matters:
- Friday rebound? Thursday’s 2,155 was the lowest weekday count. If Friday bounces back to ~2,700+, Thursday was just a blip. If it stays low, the total EV estimate shifts downward.
- Second Saturday and first Sunday: Saturday, Feb 28 and Sunday, March 1 are both voting days. The first Saturday drew 2,175 voters. If the second Saturday exceeds that, it signals broadening participation. Sunday is a wildcard: “Souls to the Polls” efforts typically benefit Democrats, though GA-14’s demographics may mute that effect.
- Final week begins Monday: The last 5 weekdays of early voting (March 2–6) will likely produce 30–40% of total early ballots. This is when we’ll see whether the district is tracking toward 50K, 55K, or 60K+ total early votes.
Questions? Get in touch at [email protected].
Civic Forge Solutions provides civic technology and data analysis services for progressive and Democratic candidates, campaigns, and committees. Based in Atlanta, Georgia.